
Collaborative research requires interconnected data.
A key example is the Clinical Virology Network, a cross-site network for the continuous collection, consolidation and analysis of virological and bacteriological laboratory data.
Many years of experience with distributed laboratory data.
Since 2009, MEDEORA has supported the Clinical Virology Network as a technical and organisational partner.
The network connects physicians, laboratories and research institutions across institutional and geographical boundaries. Its aim is to identify developments in infectious pathogens at an early stage and provide reliable data for research and public health.
What began as a network for monitoring respiratory infections has been expanded over the years to include additional pathogen groups and specialist areas.
Today, data from numerous laboratories is digitally consolidated and made available for scientific, epidemiological and publicly accessible analyses.
Figures based on publicly documented information from the Clinical Virology Network.
MEDEORA Data Network
Our many years of experience in establishing, developing and operating the Clinical Virology Network form an important foundation for the MEDEORA Data Network.
We apply proven concepts for data integration, harmonisation, visualisation and long-term operation to further projects in research, public health and the life sciences.
Dashboards for research and evidence-based decision-making.
An important component of the CVN is the clear visualisation of complex laboratory data. Interactive dashboards make trends over time, seasonal patterns and regional differences immediately visible.
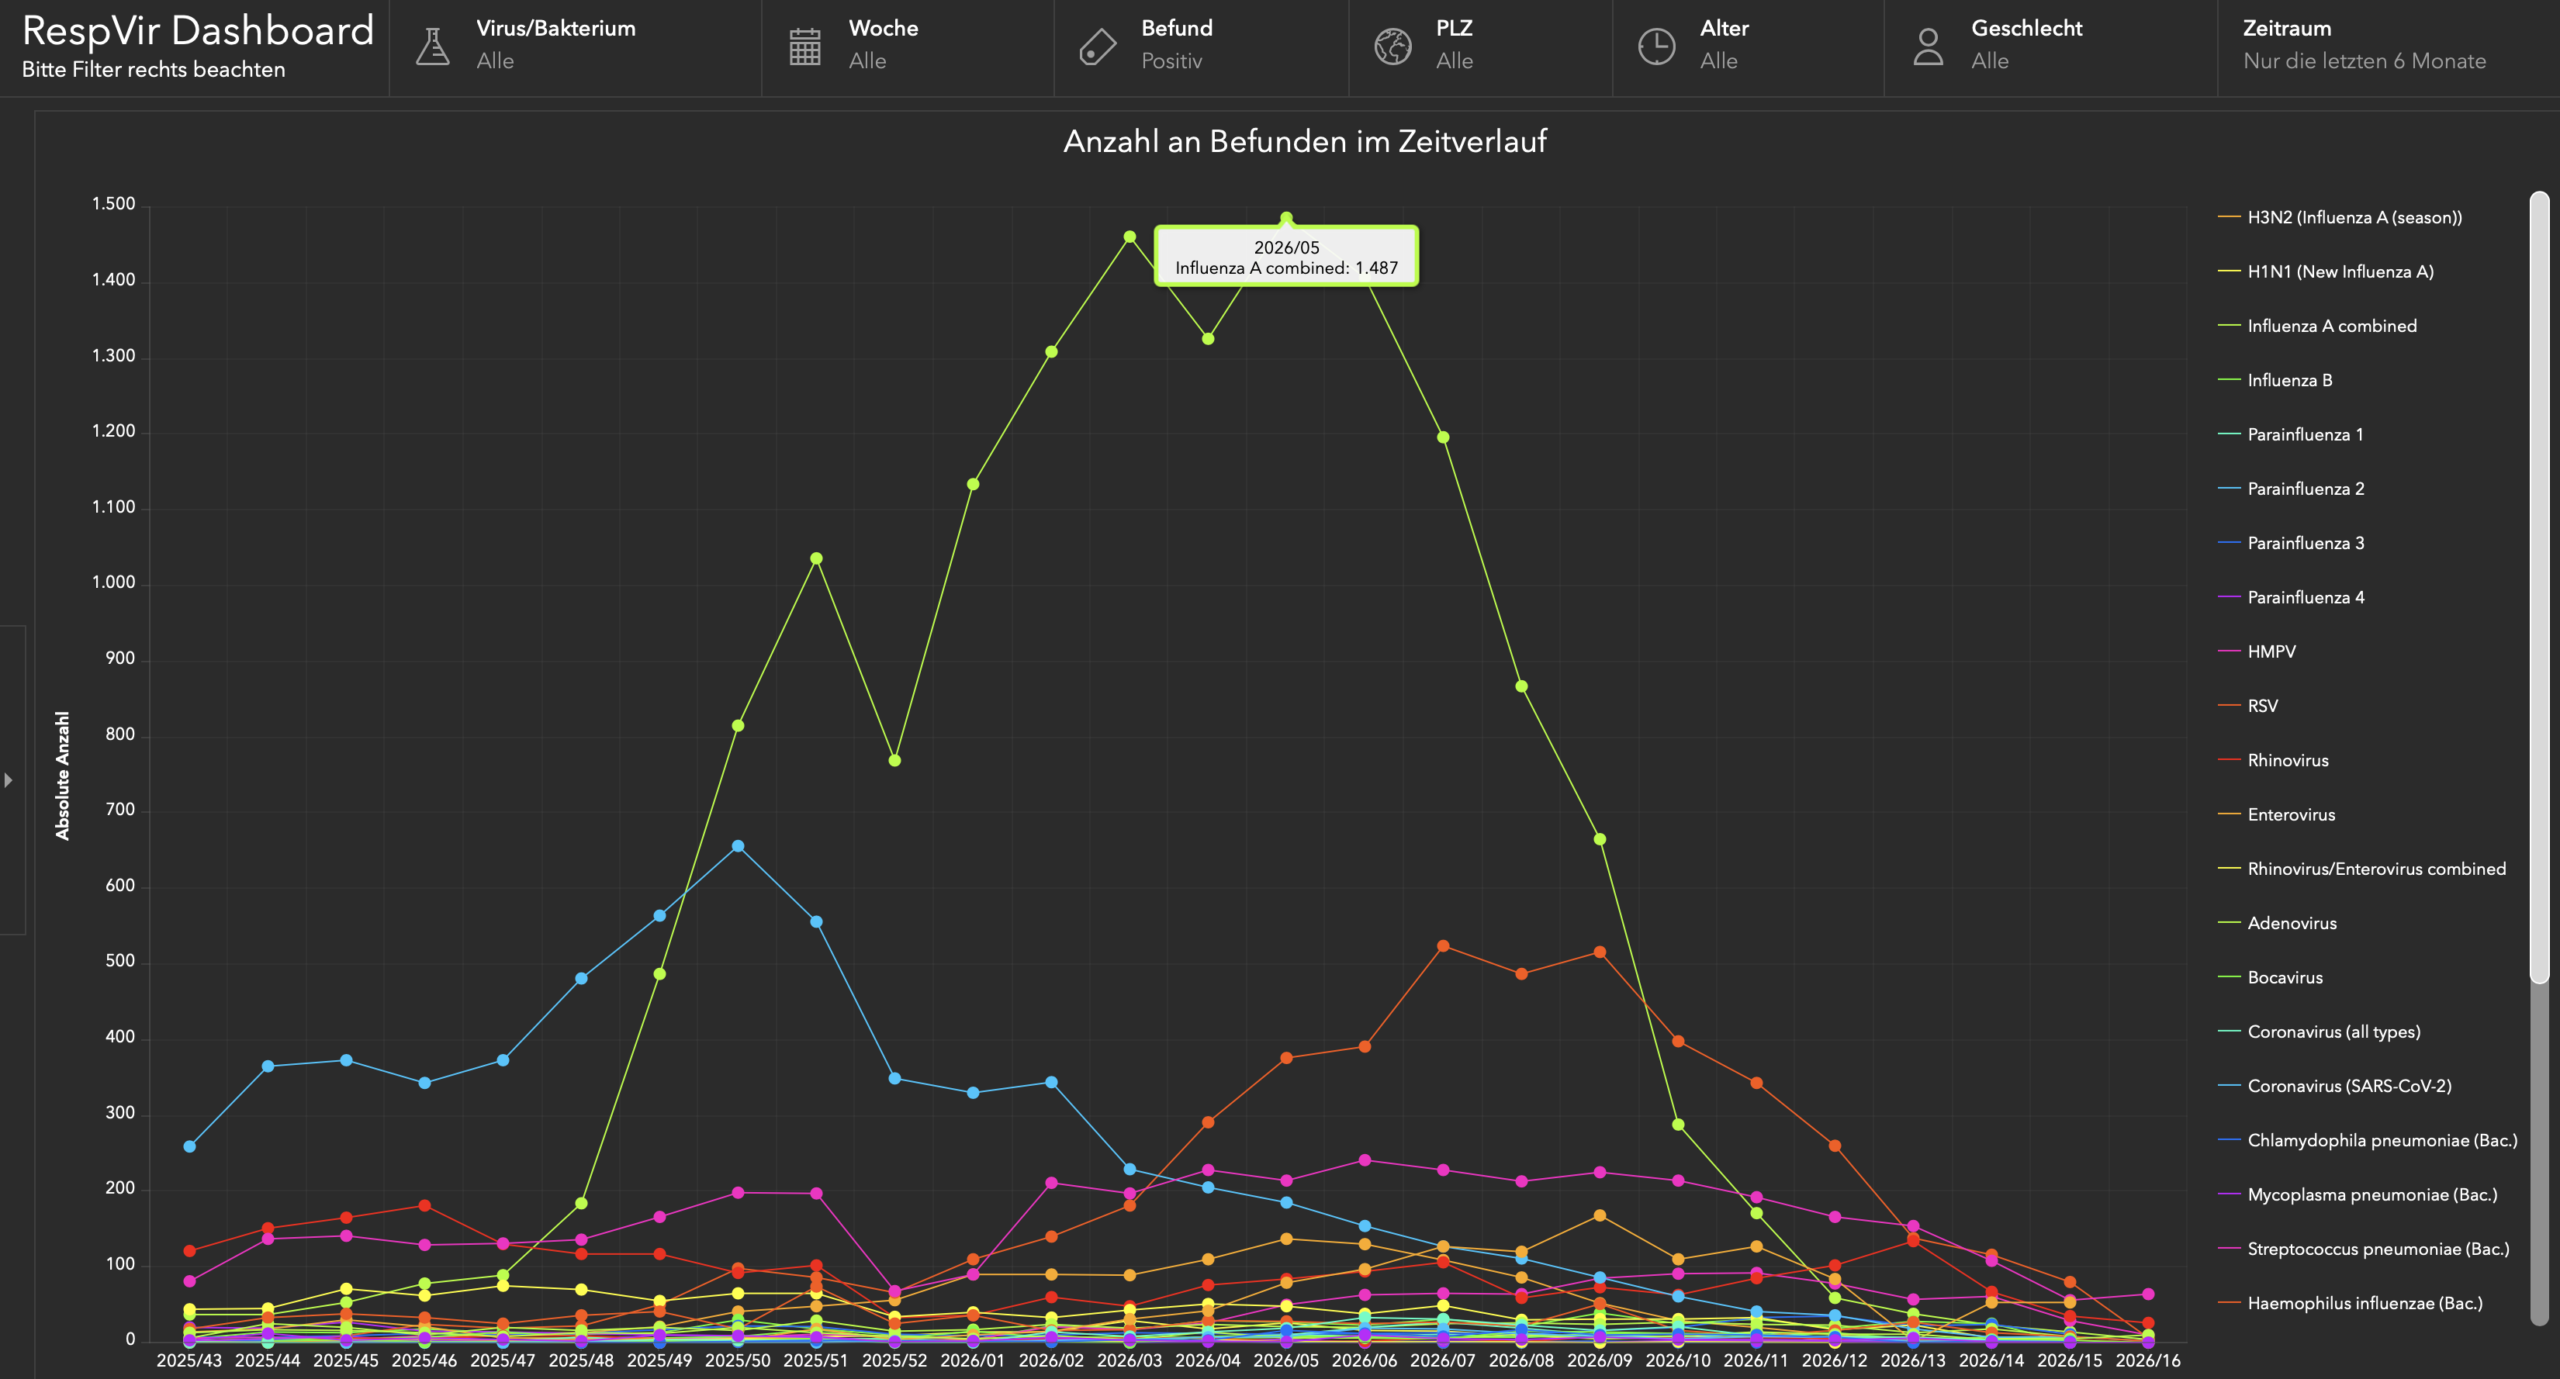
Respiratory Infections
The RespVir Dashboard shows current trends in respiratory viruses and bacteria as well as seasonal and regional patterns.
Open the Respiratory Dashboard →Gastrointestinal Infections
A further dashboard supports the analysis of the spread and temporal dynamics of gastrointestinal infections.
Open the Gastrointestinal Dashboard →Data that enables research.
The data brought together within the network provide a basis for scientific analyses and publications and contribute to the visibility of the CVN in infectious disease research.
More information about the CVN →Research requires more than a database.
High-quality data, clear structures and reliable collaboration between participating institutions are essential for successful research networks.
Connecting Data
Bring together information from different laboratories, systems and data formats.
Making Data Usable
Harmonise and structure data and prepare it for analysis and visualisation.
Operating Networks
Support technical infrastructure, data flows and collaboration over the long term.
Are you planning a project involving multiple laboratories, institutions or data sources?
Talk to us about the technical and organisational infrastructure for your project – from data integration to long-term operation.

